


“October. This is one of the peculiarly dangerous months to speculate in stocks. The others are July, January, September, April, November, May, March, June, December, August and February.” This is a great quote from Mark Twain. As the message states, not only may October be a dangerous month to speculate in stocks, every month carries risk.
What makes the month of October so worrisome for investors is their knowledge of the great stock market crashes that occurred. The crash in late October 1929 was a catalyst behind the Great Depression and the October 1987 crash still lingers in the minds of most investors.
So does the month of October deserve such a bad reputation? The statistical answer is no. A quick look at the historic monthly average returns of the Dow Jones Industrial Average (DJIA) since 1900 shows October does not deserve its bad rap. The award for the worst performing month goes to September whose average monthly return over that period is down 1.1%. October’s average return over that time frame is up 0.1%. The best month: December which was up 72% on average with a positive monthly return of 1.5%.
So why should investors look for a treat instead of a trick in October? By looking at the historic monthly returns of the stock market, an interesting pattern develops. There appears to be a seasonal tendency for the stock market to perform better over successive months than other months.
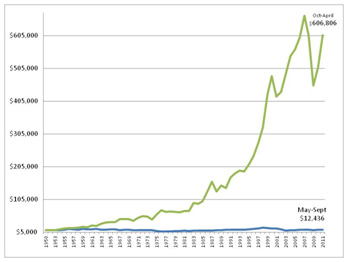
The seasonal tendency is straight forward. Split a year into two distinct investment time frames, 5 months and 7 months. With the first time frame, $10,000 is invested in May 1950 and is sold in September 1950; the cash is held until May 1951 when the proceeds are reinvested in the same manner. The other portfolio invests $10,000 in October 1950 and is sold in April 1951, with cash similarly held until reinvested in October 1951. If the pattern of two distinct investment time frames is repeated year after year for 60-years, a dramatic difference in values surfaces.
The $10,000 invested in the 5 months between May and September would have grown to $12,436. Not a great return for 60-years of work. The $10,000 invested in 7 months between October and April would have grown to $606,806. These numbers do not take into account taxes or investment expenses which would lower the overall totals. But with a 4,700% difference in returns between the two investment time frames, it is a pattern worth noting.
So where’s the catch? Not every time frame has worked. The most recent example is the period from October 2007-April 2008 which whould have resulted in a 9% loss and the October 2008-April 2008 would have resulted in a 25% loss.
While seasonality may give us a “tip” on how the stock market may have performed in the past, remember that any investment involving stocks may be “peculiarly dangerous” at any time.
Print this page
Find a planner
Related Article


